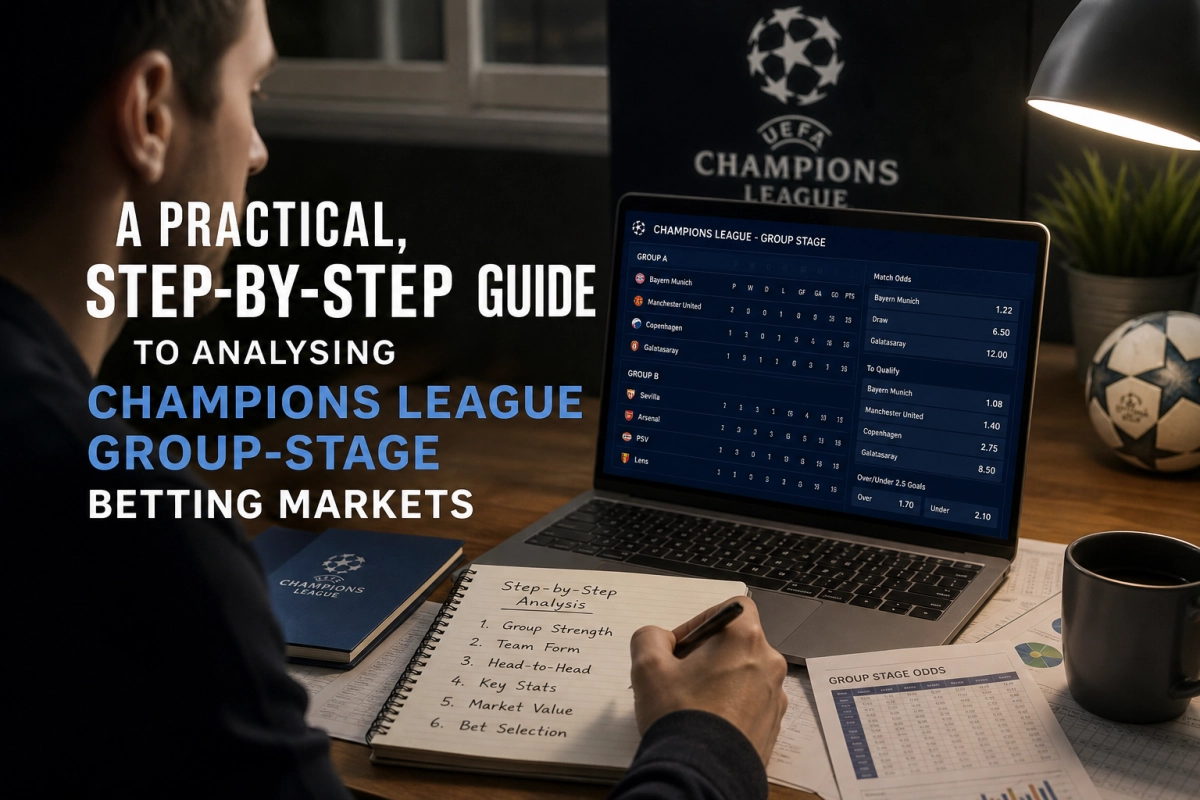
How to approach Champions League betting markets like a practical analyst
What this guide teaches and which markets to focus on
This guide explains how to analyse Champions League group-stage betting markets and translate data into measured selections. It covers the most-used markets — full-time match odds (1X2), both-teams-to-score (BTTS), over/under goals and outright qualification bets — and shows which data points matter: recent form, squad rotation, motivation, expected goals (xG), head-to-head history and odds movement. The aim is to help readers make better-informed decisions, not to promise guaranteed results.
Quick definitions of the markets beginners need to know
- Match odds (1X2): Bets on the home win, draw, or away win. Simple but requires reading likely outcomes and value.
- Both teams to score (BTTS): A yes/no market predicting whether both sides will score at least once.
- Over/Under goals: Commonly 2.5 goals; you back whether total goals will be over or under the line. Useful when expecting open or tight games.
- Outright qualification/finish: Bets on which teams will progress from a group or finish in a specific position by the group stage end.
Step 1 — Gather the right evidence: form, rotation and motivation
Start with three practical checks before looking at odds: recent form, likely team rotation and motivation level.
- Form: Look at the last six to eight matches across competitions. Prioritise underlying performance (xG, shots, chances) over single results.
- Rotation: Managers often rest starters on heavy schedules. Check confirmed line-ups where possible; trust reliable squad news to anticipate weakened XI.
- Motivation: Group standings, fixture timing and domestic priorities affect intensity. A team already qualified will often rotate and reduce attacking intent.
Step 2 — Add analytical layers: xG and head-to-head context
After the practical checks, add two statistical lenses that expose mismatches the market may underprice.
- Expected Goals (xG): Use xG to see whether a team is creating or conceding quality chances. A side with superior xG but poor recent results may offer value in match odds or goal markets.
- Head-to-head: Tactical matchups matter. Past meetings can reveal how teams cancel each other out, which informs BTTS and over/under expectations more than broad form alone.
These early steps — defining the market, checking form/rotation/motivation, and layering xG and H2H — set a factual baseline. The next section explains how to read odds movement, convert the baseline into implied probabilities, and identify value across match and outright qualification markets.
Step 3 — Read odds, convert to implied probability and spot movement
Once you have your evidence baseline, the next essential skill is translating bookmaker prices into probabilities and watching how those prices move. A market price encodes both the perceived chance of an outcome and the bookmaker’s margin. You need to strip the margin to compare your estimate with the market’s fair view.
- Convert decimal odds to implied probability: implied probability = 1 / decimal odds. Example: odds 2.50 → 0.40 (40%). Do this for each outcome.
- Remove the overround (vig): bookmakers’ three-way markets add up to more than 100%. Normalize by dividing each implied probability by the total sum. Example: odds 2.50 (40%), 3.20 (31.25%), 3.00 (33.33%) sum ≈ 104.58%. Divide each by 1.0458 to get fair probabilities.
- Compare to your model/estimate: if your assessment gives the home win a 48% chance and the market’s fair probability is 40%, there’s theoretical value — quantify the edge and size stakes accordingly.
Odds movement is the market’s second signal. Track early lines through to kick-off. Sharp movement (large, fast shifts, often with limits reduced by bookmakers) often reflects professional money or new team news. Slow drift usually reflects public sentiment. Both are useful: sharp shortening can confirm late injury/team-sheet intelligence; public-driven shortening can create contrarian opportunities if your baseline disagrees.
Step 4 — Apply the baseline to specific markets: 1X2, BTTS and over/under, plus outrights
Different markets respond to the same evidence in different ways. Below are practical rules to turn the data into market-specific selections.
- Match odds (1X2)
Use your form, rotation and xG work to estimate a fair probability. Adjust for squad news: a heavy rotation typically reduces an away favourite’s edge more than the market reflects. Look for value of at least 5–8% above fair probability before staking. If you quantify expected goals difference (team A xG minus team B xG) and translate that into a win probability using simple logistic scaling you’ll avoid gut-only bets.
- Both teams to score (BTTS)
BTTS is about attacking intent and defensive frailty. Start with each team’s non-penalty xG per 90 and their xG conceded. Practical rules: if both sides average above ~1.0 xG per game and neither has rotating keepers/defensive personnel, BTTS-Yes is likelier. Head-to-head history matters: two defensively cautious sides can produce low BTTS rates even with decent xG. Adjust the market probability by accounting for rotation (a second-string keeper or inexperienced backline reduces BTTS probability).
- Over/Under goals
Use the sum of both teams’ xG to set a baseline for common lines (2.5 and 3.5). As a rule of thumb, combined xG comfortably above 2.5 supports Over 2.5; combined xG below ~1.8 supports Under 2.5. Factor in motivation — a team needing a win late in the group will likely push the game open — and referee/pace tendencies. If both teams rotate heavily, expect fewer goals than modelled from season-long xG.
- Outright qualification/finish
Outrights require thinking beyond a single match. Convert your match probabilities into stage simulations. A simple approach: use your estimated 1X2 probabilities for each remaining fixture and simulate the group thousands of times (Monte Carlo) to get qualification odds. Practical shortcuts: if a team’s implied qualification odds are much lower than the sum of your match-based simulations, there’s value. Be mindful of tie-break rules (head-to-head first in most UEFA formats), squad rotation across matchdays and the long variance — keep stakes smaller and shop multiple bookmakers for the best outright price.
In short: convert odds to fair probabilities, monitor price changes for new information or public bias, and apply your xG/rotation/motivation assessment differently for each market. The next part explains staking, record-keeping and how to refine your model across group matchdays.
Staking, record-keeping and model refinement
Practical edge analysis only pays off when paired with disciplined money management and continual learning. Treat the following as operational rules to keep your approach consistent and improvable.
-
Staking and bankroll rules
Decide a unit size and stick to it. Common practical approaches:
- Flat staking: fixed units per selection to control variance and simplify tracking.
- Percentage staking: small fixed percent of bankroll (e.g., 1–2%) for proportional risk control.
- Fractional Kelly: use a reduced Kelly fraction if you model edge precisely, but be conservative — overestimating edge multiplies drawdown risk.
- Smaller stakes for outrights and long-shot markets: higher variance means lower recommended stake per selection.
-
Record-keeping fields
Keep a structured log for every bet so you can measure skill over time:
- Date, competition, fixture and market (1X2, BTTS, O/U, outright).
- Bookmaker odds and implied probability (after removing vig), your fair probability estimate, and calculated edge.
- Stake, stake type (unit/%), and outcome (return/loss).
- Contextual notes: rotation, confirmed line-ups, weather/referee notes, and any late news that affected odds movement.
- Tagging for model inputs used (xG, head-to-head, motivation) to allow later analysis of which signals were predictive.
-
Refinement routine
Schedule regular review cycles to close the learning loop:
- Weekly: check calibration — do your odds forecasts match outcomes across that span?
- Monthly: analyse ROI by market and by input signal (xG, rotation, motivation) to reweight your model.
- Post-group stage: review outrights and model assumptions about tie-breaks and rotation across matchdays.
- Keep an eye on market behaviour: identify recurring bookmaker or public biases to exploit (e.g., overreaction to star names, underpricing rotation risk).
Putting the process into action
Be methodical, patient and humble. Value identification is a long-game skill: small, repeatable edges compound while discipline limits the damage of inevitable variance. Preserve your bankroll, log everything, learn from mismatches between your forecasts and real outcomes, and always let the evidence — not emotion or hot streaks — guide stake sizing. If you treat the process as research that improves over time, your analysis will become sharper and your decisions more consistent.