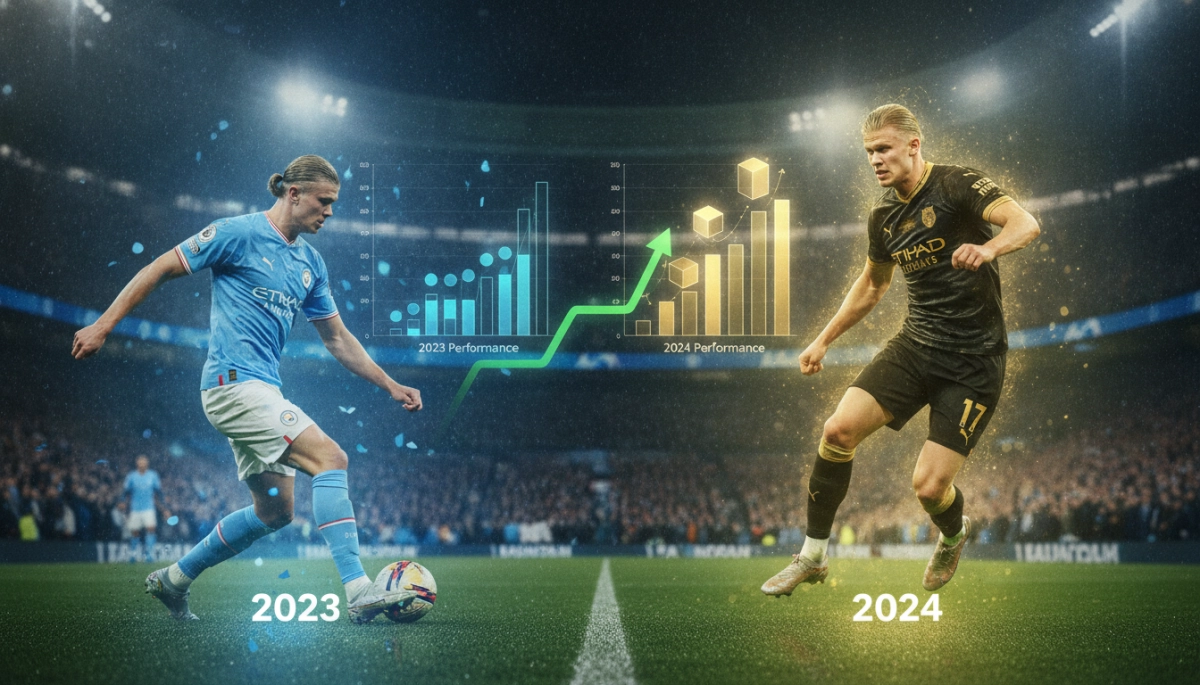
What matters when you compare Haaland’s 2023 and 2024 numbers
When you set out to compare Erling Haaland across two calendar years, you need a clear framework. Raw goal totals are attention-grabbing, but they don’t tell the whole story. To judge whether Haaland is getting better you should look at efficiency (goals per 90, minutes per goal), quality of chances (xG and non-penalty xG), involvement in build-up (assists, key passes, xA), and context (minutes played, competition mix, penalties and injuries).
Think of the comparison as three layers: what he produced, how efficiently he produced it, and why the numbers changed. Production answers “how many” — goals, assists, shots. Efficiency answers “how well” — conversion rates, expected goals per 90. Context answers “why” — team tactics, opponent strength, and match roles. If you follow the right metrics, you can avoid misleading conclusions based solely on headline totals.
Key metrics you should track
- Goals, non-penalty goals, and goals per 90
- Shots per 90 and shot conversion (%)
- Expected goals (xG) and non-penalty xG
- Assists, key passes, and expected assists (xA)
- Touches in the penalty area and progressive carries
- Minutes played, substitutions, and injury absences
Early differences between 2023 and 2024: scoring and involvement
Looking at the early comparative picture, you’ll notice two clear themes. First, Haaland remained an elite scorer across both years — the consistency in finding the net is a defining trait. Second, subtle shifts in how he contributes to the team start to appear: some indicators point to improved link-up play and chance creation, while pure finishing efficiency can fluctuate season-to-season.
Scoring efficiency: what to watch
Rather than fixating on total goals, you should focus on per-90 metrics and conversion. If his goals per 90 stayed stable or improved while his minutes rose, that suggests better durability or a larger role. Conversely, a drop in conversion with stable xG per 90 may indicate fewer high-quality chances or natural regression from an unusually hot run the previous year.
Playmaking and presence in the final third
Pay attention to assists, key passes, and touches inside the box. If you see growth in expected assists and progressive passes, that means Haaland is becoming more involved in build-up and creating chances for teammates, not just finishing them. Increased touches in the penalty area paired with stable shot volume point to a forward who is commanding more of the attacking phase.
These early observations give you a sense of direction, but they don’t close the case. Next, you’ll want a deeper breakdown by competition (league vs. Champions League), per-90 comparisons, and how team tactics shaped his opportunities — we’ll examine those details in the next section.
Breakdown by competition: league, cups and European nights
When you split Haaland’s output by competition you often find the clearest explanations for headline swings. League play delivers regular minutes against a predictable range of opposition; cups and the Champions League bring variation in opponent quality, rotation patterns, and game state that affect counting stats.
Look for these patterns: if Haaland’s league goals per 90 are steady but his Champions League goals spike, that could reflect City prioritising him for European fixtures or simply a hot streak against specific opponents. Conversely, a higher goals tally in domestic cups might be inflated by matches against lower-division sides or early-round rotation. Also check penalty distribution across competitions — a player with more spot-kicks in one year can see totals jump without underlying finishing improving.
Important comparisons: minutes per goal, non-penalty goals per 90 and non-penalty xG per 90 in each competition. If his non-penalty xG rises in Europe but conversion falls, that points to chance quality improving but finishing regressing. If both xG and non-penalty goals rise in the league, that indicates genuine growth in territory and opportunity rather than luck. Segmenting by competition removes the “apples and oranges” problem and reveals whether improvements are broad-based or competition-specific.
Per-90 and expected metrics: quality over raw counts
Per-90 and expected metrics are the best corrective to raw totals. Goals per 90 and xG per 90 normalize playing time; expected assists (xA) and key passes per 90 show creative growth that raw assists miss due to the unpredictability of teammates converting.
When judging 2023 vs 2024, prioritize non-penalty xG per 90 to filter out the penalty effect. Pair that with shot-creating actions and touches in the box per 90: rising xG with more penalty-area touches signals that Haaland is getting into better scoring positions more often. Shot conversion should be tracked with caution — a short-term dip may just be regression to the mean after an exceptional year, while a sustained decline alongside falling xG per 90 suggests opponents are denying him prime chances.
Also monitor shot profile: are more shots coming from inside the six-yard box, or from distance? A shift toward higher-value attempts (close-range headers, tap-ins) with stable xG indicates better positioning and finishing discipline. Finally, compare progressive carries and progressive passes per 90 to capture off-the-ball work that creates those high-xG moments.
Tactical context: how role and team shape created opportunities
Numbers rarely change in isolation — they reflect tactical tweaks. Haaland’s raw and underlying stats will respond to formation shifts, the positioning of wide players, and whether he is tasked with anchoring the box or dropping to combine.
If the team increases inverted full-back overlaps or channels more through the wings, that can create more cutbacks and high-percentage chances inside the box, lifting his non-penalty xG. If Haaland is asked to drop deeper as a false nine or to drift wide to create overloads, expect assists and progressive passes to rise even if raw shot volume falls. Pressing intensity and transition speed matter, too: a faster counter-attacking setup produces fewer sustained build-up chances but higher-quality transition opportunities.
To connect tactics to stats, watch heatmaps, average position, and pass combinations leading to shots. When those show more involvement in build-up and sustained proximity to the goal, a corresponding rise in xA, key passes, and in-box touches confirms that tactical change is driving statistical evolution — not just luck or variance.
Looking ahead: how to judge progress beyond the headlines
Haaland’s yearly numbers will keep fluctuating — that’s inevitable. What matters is keeping a clear lens: focus on rate metrics, the quality of chances he receives, and the tactical role he’s asked to play. Short-term spikes or dips are usually noise; sustained changes over multiple months that align with tactical shifts or workload changes are the real signals.
Practical checklist for future comparisons
- Track non-penalty xG per 90 and goals per 90 rather than raw totals to control for minutes and penalties.
- Watch involvement metrics (touches in the box, progressive carries, key passes) to see if his role is broadening or narrowing.
- Segment by competition — league, cup, and continental play often paint different pictures because of rotation and opponent quality.
- Compare shot profile and location to detect whether chance quality is changing (more tap‑ins vs more long-range attempts).
- Factor in team tacticals and personnel changes — new coaches, different wide players, or formation tweaks materially affect opportunity creation.
If you want a reliable place to follow match-by-match and season summaries while tracking the metrics above, data sites such as FBref are useful starting points. Use those resources alongside match observation — numbers are powerful, but context completes the picture.
Ultimately, judge improvement by whether Haaland’s underlying opportunity profile (quality and frequency of chances) and contribution to the team’s attacking patterns are trending in the right direction over a meaningful sample, not by one calendar-year tally. That approach will tell you whether changes in his statline reflect genuine development or just the ebb and flow of form and circumstance.