Why combining bookmakers’ odds with xG gives smarter soccer betting choices
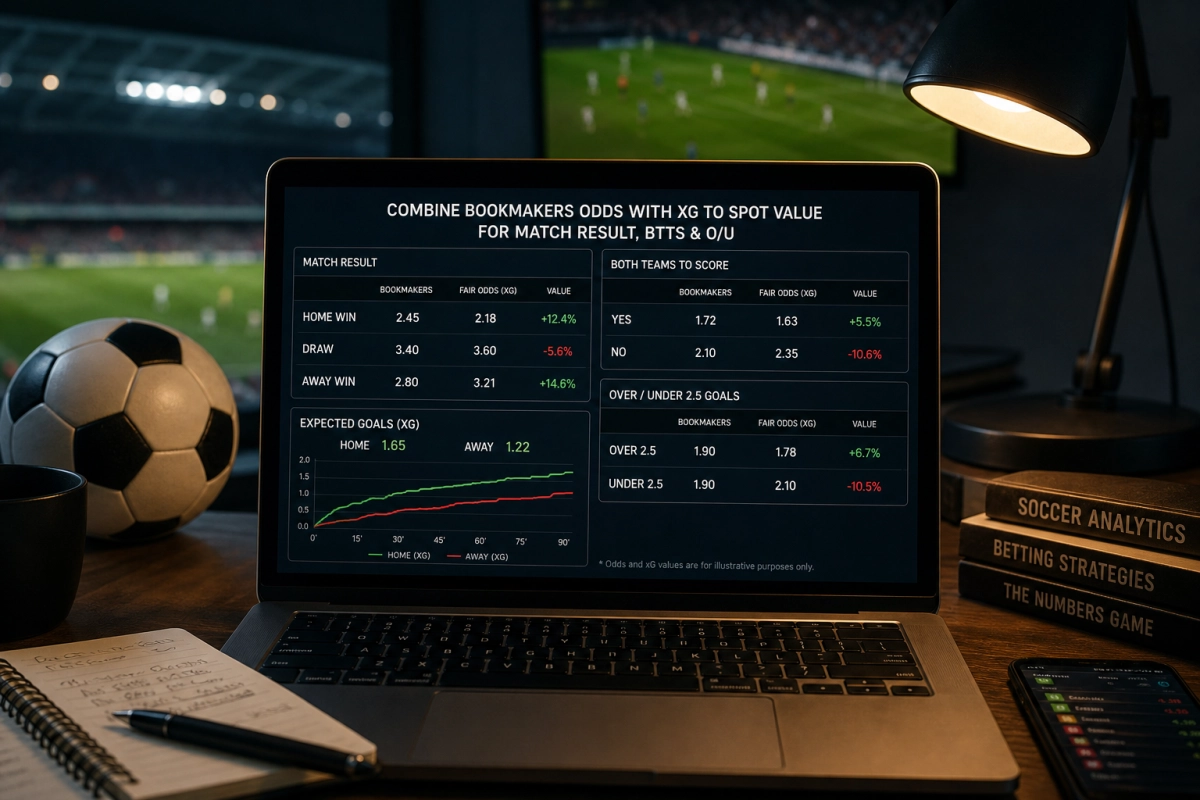
This guide explains how to use bookmakers’ odds together with expected goals (xG) metrics to find value in common soccer betting markets: match result (1X2), both teams to score (BTTS) and over/under goals. Readers will learn simple calculations, what xG does and doesn’t show, and an easy workflow to compare market prices with model probabilities both before kick-off and during live play. The approach is practical for both beginners and experienced punters who want evidence-based decision making without claims of certainty.
How odds, implied probability and xG fit together
Bookmakers publish decimal odds that reflect market expectations plus a margin (the vig). Converting odds to implied probability is the first step to compare market pricing with an xG-based estimate.
Converting odds and removing the bookmaker margin
- Implied probability from decimal odds: probability = 1 / odds. Example: odds 2.50 → implied probability 0.40 (40%).
- Remove the overround (simple proportional method): sum the raw implied probabilities for all outcomes, then divide each by that sum to get the market’s normalized probability.
- Use the normalized market probability as the benchmark to compare with your xG-derived probability.
What xG measures and its practical limits
Expected goals (xG) estimates the quality of scoring chances by assigning each shot a value between 0 and 1. Aggregated over matches it signals attacking threat and defensive vulnerability better than goals alone.
- Use team xG for and xG conceded, and adjust for home/away when possible.
- xG is a predictive tool, not certainty: it doesn’t capture late-match red cards, tactical changes, or injuries that occur after data collection.
- For live betting, compare real-time shot quality and fresh xG flow to pre-match baselines to see where the market may lag.
How xG informs the three main markets
Match result (1X2)
Common methods use team xG to estimate expected goals for each side and then apply a Poisson or logistic model to derive probabilities for home win, draw and away win. As a quick heuristic, greater positive xG difference increases win probability; a normalized comparison against market odds reveals potential value.
Both teams to score (BTTS)
BTTS is sensitive to both teams’ attacking xG and defensive xG conceded. If both sides consistently produce high xG-for and concede chances, your model probability for BTTS will be higher than a market price focused on recent goals scored alone.
Over/Under goals (example for over 2.5)
Sum the expected goals for both teams to get the match’s expected total goals (lambda). Under a Poisson assumption you can calculate the probability of 3+ goals. Example: if combined xG = 2.7, Poisson gives P(0)+P(1)+P(2) ≈ 0.4937, so P(3+) ≈ 0.5063 (about 50.6%). Compare that to the normalized market probability for over 2.5 to spot discrepancies.
With these foundations—odds conversion, margin removal, and xG-to-probability concepts—readers can begin to identify where bookmakers’ prices differ from data-driven expectations. The next section will walk through step-by-step pre-match calculations, a simple Poisson implementation, and live-play adjustments to turn these ideas into actionable soccer betting checks.
Step-by-step pre-match calculation using xG and Poisson
Start with clean inputs: home team xG-for per 90, away team xG-for per 90, and each side’s xG conceded per 90 (or aggregated team attack/defence ratings). A simple, defensible workflow:
1. Adjust for venue: if you have separate home/away xG numbers, use them. If you only have season averages, apply a home advantage multiplier (typical range 1.05–1.12 for goals/xG).
2. Create expected goals for the match (λhome and λaway). A simple approach is to take each team’s attack xG-for and multiply by the opponent’s defensive xG-conceded relative to league average. Example: home_lambda = home_xG_for * (away_xG_conceded / league_avg_xG_conceded).
3. If you prefer an even simpler shortcut, average the two corresponding metrics: (home_attack + opponent_defence_adjustment) / 2 — whatever is consistent across the matches you evaluate.
4. Convert each λ to a probability distribution using the Poisson formula:
P(k goals) = e^(−λ) * λ^k / k!
You’ll typically compute P(0) … P(5+) (treat k≥5 as one bucket to keep computations compact).
5. Build the full scoreline matrix by multiplying independent Poisson probabilities for home and away scores (P_home(k) * P_away(j)). Sum the cells where home goals > away goals for a home win probability; equal goals for a draw; away goals > home for an away win.
6. Compare your model probabilities to the market’s normalized probabilities (remove vig first). A straightforward value rule: if your model probability minus market probability > your threshold (e.g., 3–5 percentage points) you may have an edge worth betting on.
This is intentionally basic: it assumes independence and no time dynamics, but it’s transparent, fast, and often good enough to identify obvious market mispricings.
Quick implementation tips (Excel and small Python snippets)
You don’t need heavy coding to use this method.
– Excel: use POISSON.DIST(lambda, k, FALSE) for individual probabilities and POISSON.DIST(lambda, k, TRUE) for cumulative values. Build a 6×6 grid for 0–5 goals and compute cell =P(home k)*P(away j). Sum across ranges for 1X2 and for BTTS (sum of cells where k>0 and j>0).
– Python (minimal): import math; poisson = lambda lam,k: math.exp(-lam)lam*k/math.factorial(k). Use nested loops k,j in range(6) to get the matrix, then aggregate.
– Calibration: if your model systematically over- or under-estimates goals vs actual outcomes, scale λ by a small factor (e.g., multiply by observed goals / predicted goals over a calibration set). Small, consistent adjustments often beat complex overfitting.
Optional: if you want more accuracy for 1X2, consider a Dixon–Coles correction to account for low-scoring correlation (mainly useful in full-season models, less so for quick pre-match checks).
Practical live-betting adjustments: reading xG flow and state variables
In-play value comes from changing λs as the game unfolds. Key ideas to update quickly:
– Recompute remaining λs proportional to minutes left. If pre-match λhome = 1.6 and 30 minutes have passed, remaining_lambda_home ≈ 1.6 * (60/90) adjusted by how many goals/chances already occurred.
– Use live xG flow (many providers show cumulative in-match xG for each side). If one team’s live xG exceeds their pre-match expectation early, increase their remaining λ and decrease the opponent’s — the market often lags this signal.
– Account for non-xG events: red cards, tactical substitutions, injuries and obvious momentum shifts. Heuristics: trailing team attacking intent multiplier (1.1–1.4 depending on severity), red-card penalty reduces the disadvantaged team’s λ by ~25–50% for the remainder depending on minutes left.
– Time-sensitivity: probability swings late in a match are amplified. Recompute Poisson on remaining minutes rather than full-match totals to reflect urgency.
– Risk control: live xG is noisy — prefer sustained xG swings (multiple high-quality chances or consistent pressure) over single shots. Also watch liquidity: in-play prices can be wide but fast-moving.
These practical adjustments let you turn pre-match expectations into real-time edge hunting for match result, BTTS and over/under lines without complex modelling or heavy computation.
Quick pre-bet checklist
- Confirm market probabilities have been normalized (vig removed) before comparing with your xG-derived probabilities.
- Verify your model edge exceeds your chosen threshold (e.g., ≥3–5 percentage points) and that implied odds offer value after sportsbook limits and liquidity are considered.
- Check for game-changing news (starting XI, red cards, injuries, weather) that could invalidate pre-match xG assumptions.
- For live bets, wait for sustained xG flow or repeated high-quality chances rather than reacting to isolated events.
- Size stakes relative to edge and bankroll (use fractional Kelly or fixed-percent staking) and avoid chasing losses after a losing streak.
- Keep clear records of bets, inputs, and outcomes so you can recalibrate λ scaling, thresholds and heuristics over time.
Discipline, testing and continuous improvement
Using bookmakers’ odds together with xG is a practical way to look for value, but it is not a shortcut to certainty. Treat the approach as an experiment: test ideas on a small scale, record results, and calibrate consistently. Protect your bankroll with disciplined staking, and be honest about biases and variance — even edges can lose in the short run.
Over time, focus on the process more than individual outcomes. Improve by refining your inputs (better home/away splits, live xG interpretation), checking calibration regularly, and learning when the market is right or when your model needs adjustment. With patience, simple, repeatable checks that combine market prices and xG information can produce more informed, defensible bets — and better long-term decision making — without pretending to eliminate uncertainty.